Tech Tips to reduce your mobile app uninstall rates and optimise UI Performance
Kudos, so everything went okay, and you finally launched your app. Once the app has been downloaded, you are not out of the woods. The study has shown that anywhere from 80 to 90 percent of all downloaded apps are used once and then eventually deleted by users. Customers are easily distracted, and with so many choices in the app markets, if your app doesn’t match to the user’s expectations, they will quickly try a similar app. Although there are many reasons why users uninstall apps, it can be argued that being frustrated with an app is the top reason for its uninstall. According to a study by Perfecto Mobile, the top user frustrations are as follows:
- User interface issues (58%)
- Performance (52%)
- Functionality (50%)
- Device compatibility (45%)
While performance is directly called out as the number two reason for customer frustration, it is clear that the other responses also have aspects of performance to them. It becomes pretty clear that the major reasons customers stop using apps are due to issues related to performance.
UI performance It is important to ask the following questions before submitting an app. These questions may be as trivial as How does the UI that your designers designed (and you built) run? Do the pages load quickly? Do they respond in a fast and smooth way?
Objective How to optimise your UI for fast rendering and scrolling/animations, And the tools you can use to profile your screen and UI performance.
UI Performance Benchmark Like all performance goals, it is important to understand the performance goals associated with UI. Saying “my app needs to load faster” is great, but what are the expectations of the end user, and are there concrete numbers you can apply to those expectations? In general, we can fall back on studies of the psychology of human interactions. These studies have shown that users perceive delays of 0 – 100 ms as instantaneous and delays of 100 – 300 ms as sluggish; delays between 300 – 1,000 ms indicate to users that “the machine is working,” whereas delays of 1,000+ ms lead users to feel a context switch.Once you figure out the way things should work, it makes finding the issues easier.
Jank In addition to getting content on the screen as quickly as possible, it has to render smoothly. The Android team refers to jerky, unsmooth motion as jank, and this is caused by missing a screen frame refresh. Most Android devices refresh the screen 60 times a second (there are undoubtedly exceptions — earlier Android devices were sometimes in the 50 or fewer fps range). Because the display is refreshed every 16 ms (1 s/60 fps = 16 ms per frame), it is crucial to ensure that all of your renderings can occur in less than 16 ms. If a frame is skipped, users experience a jump or skip in the animation, which can be jarring. To keep your animations smooth, we’ll look at ways to ensure the entire screen renders in 16 ms. Below, we’ll diagnose common issues and illustrate how to remove jank from your UI.
Goals Lower the latency of screen draws.Create fast, consistent frame rates to avoid jank.
Building Views When building your views, it is important to look at the Component Tree in the upper-right of the screen. The more nested your views become, the more complicated the View Tree becomes, and the longer it will take to render.For each view in your app, Android goes through three steps to render on the screen: measure, layout, and draw.
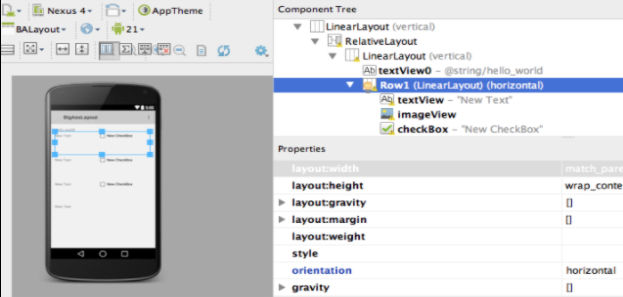
If you imagine your XML layout hierarchy in your app, the measure starts at the top node and walks the render tree of the layout: measuring the dimensions of each view to be displayed on the screen (in above Figure: LinearLayout, RelativeLayout,LinearLayout and then branching for textView0 and the LinearLayout Row1—which has three further children). Each view will provide dimensions to the parent for positioning. If a parent view discovers an issue in the measurements of its dimension (or that of its children), it can force every child (grandchild, great-grandchild, etc.) to remeasure to resolve the issue (potentially doubling or tripling the measurement time). This is the reason a flat (less nested) view tree is valuable. The deeper the nodes for the tree, the more nested the measurement, and the calculation times are lengthened (especially on remeasurements).
Remeasuring Views There does not have to be an error for a remeasure to occur. Relative Layouts often have to measure their children twice to ensure that all child views are laid out correctly. Linear Layouts that have children with layout weights also have to measure twice to get the exact dimensions for the children. If there are nested LinearLayouts or Relative Layouts, the measured time can grow in an exponential fashion (four re-measures with two nested views, eight re-measures with three nested views, etc.). Once the views are measured, each view will layout its children, and pass the view up to its parent—all the way back up to the root view. Once the layout is completed, each view will be drawn on the screen. Note that all views are drawn, not just the ones that are seen by your customers. The more views your app has, the more time it will take to measure, layout, and draw. To minimise the time this takes, it is important to keep the render tree as flat as possible and remove all views that not essential to rendering. Removing layers of the layout tree will go a long way in speeding up the painting of your screen. Ideally, the whole measure, layout, and draw should be well below the 16 ms threshold—ensuring smooth scrolling of your UI on the screen.
ConstraintLayout allows you to create large and complex layouts with a flat view hierarchy (no nested view groups).
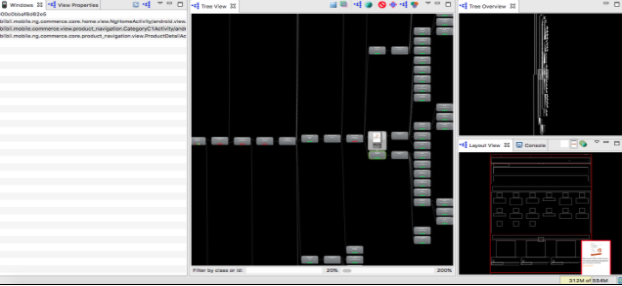
Hierarchy Viewer Finds the redundant views (and views that add delay to screen rendering). Helps you visualise the views in your Android app to resolve these issues.Below is a snapshot showing its usage.More details about its usage will be covered in upcoming posts.
Analysing For Jank (Profiling GPU Render) After the view hierarchy and overdraw have been optimised, you may still be suffering from lost frames or choppy scrolling: your app still suffers from a case of jank. To get an overall view of the jank in your app, Android has added Profile GPU Rendering as a Developer Option. This measures how long it takes each frame to draw onto the screen. You can either save the data into a logfile (adb shell dumpsys gfxinfo), or you can display the GPU rendering as a screen overlay in real time on the device (available on Android 4.2+) as shown below. The green horizontal line represents 16 milliseconds. To achieve 60 frames per second, the vertical bar for each frame needs to stay below this 16 ms mark. Any time a bar pushes above this line, there may be pauses in the animations.In upcoming posts, will dive into more details.

Systrace If you are still experiencing jank after optimising all of your views, all is not lost. The Systrace tool is another way to measure the performance of your app, and it can also help you diagnose where the issue might lay. Systrace traces can be run either from a command line or from a graphical user interface.
Generating a Trace In Android Studio, open an Android application project. Open the Device Monitor by selecting Tools > Android > Android Device Monitor. In the Devices tab, select the device on which to run a trace. If no devices are listed, make sure your device is connected via USB cable and that debugging is enabled on the device. Click the Systrace icon at the top of the Devices panel to configure tracing. Set the tracing options: To study the interactions on the screen, we’ll just collect the CPU, graphics and view data.For the study of jank, we are primarily looking at the way the app in question draws, and the when the screen refreshes. As long as these two partners are in sync, the dance of the screen rendering will be smooth. However, should either take a misstep, there will be the opportunity for there to be a jitter or jank in the rendering of the page. Click OK to start the trace.The trace is recorded into an HTML file that can be opened in your browser.
Trace Analysis Each app that is rendering frames shows a row of frame circles, which are typically coloured green. Circles that are coloured yellow or red, exceeding the 16.6 milliseconds run time limit required to maintain a stable 60 frames per second. Zoom in using the ‘w’ key to see the frames of your application, and look for long-running frames getting in the way of smoothness.
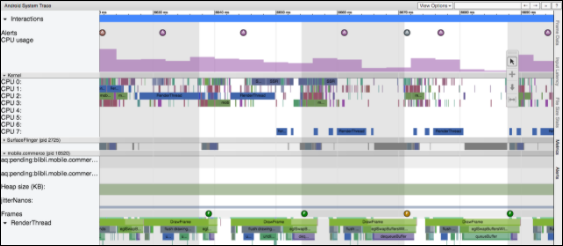
Systrace screen painting Now lets walk through the screen painting using below figure as an example.
The top row of the trace is the VSYNC, consisting of wide, evenly spaced teal bars. VSYNC is the signal to the OS that it is time to update the screen. Each bar denotes 16 ms (as does the white space between the bars). When a VSYNC event occurs (at either end of the teal bar), the surfaceflinger (consisting of several colours of bars from purple-orange and teal) to grab a view from the view buffer (not shown) and displays the image on the screen. Ideally, surfaceflinger events will be 16 ms apart (no jank), so gaps indicate times where the surfaceflinger missed a VSYNC update—the screen did not update in time (and where to look for causes of jank). You can see such a gap about 1/3 of the way through the trace. The bottom row is the RenderThread, where the views are rendered and sent to the buffer. Note that these bars get thicker at the same location as the potential jank in the surfaceflinger (about one-third of the way through the trace), indicating that something in the app may have been the cause of the jank. You can exceed the 16.6 ms time to render a frame occasionally, as there are often one or two buffered frames ready to go. However, if you have two or three slow frame renders in a row, your customers will experience jank.
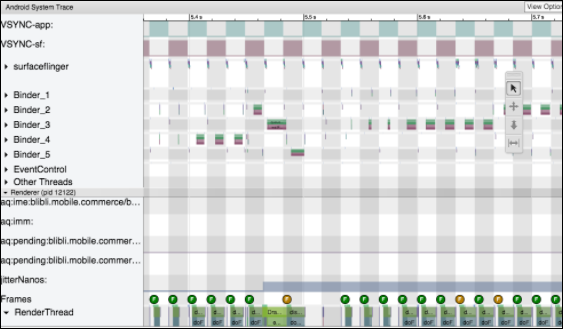
Systrace of proper rendering (Lollipop)
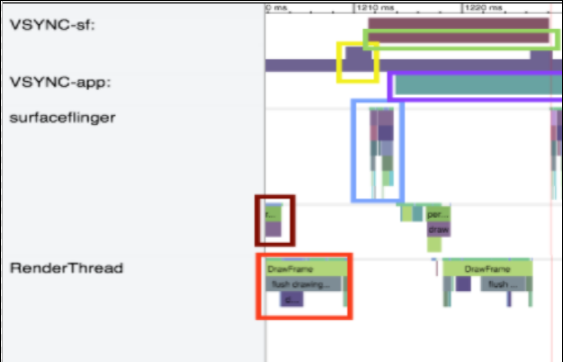
- Red box: It shows finishing of a measure of the views of the screen. These are passed to the RenderThread.
- Orange box: RenderThread. Here the app:
- Draws the frame (light green).
- Flushes the Drawing buffer (grey).
- Dequeue the buffer (in purple).
- Sends this to a buffered list of views.
- Yellow box: This is the list of views in a buffer. The height of the line denotes how many views are buffered. At the start, there is one, and when the view is passed to the buffer, the height doubles to two.
- Green box: VSYNC-sf alerts the surface flinger that it has 16 ms to render a screen. The brown bar on this line is 16 ms long.
- Blue box: surfaceflinger grabs a view from the queue (note in the yellow box that the buffer queue drops from 2 to 1). Upon completion, this view is sent off to the GPU, and the screen is drawn.
- Purple box: VSYNC-app now tells the app to render another view (and shows a 16 ms timer).As soon as the VSYNC begins, the process repeats itself again, measuring the views, passing to the RenderThread, and so on. And the cycle continues.
Investigating Alerts Systrace does an automatic analysis of the events in the trace, and highlights many performance problems as alerts, suggesting what to do next.
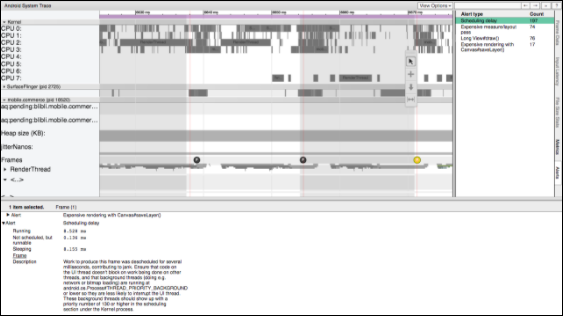
After you select a slow frame such as the one shown in Figure above, an alert may be displayed. In the case above, it calls out that the code on the UI thread is blocked by work being done on other threads.So one must ensure that background threads (doing e.g. network or bitmap loading) are running at android.os.Process#THREAD_PRIORITY_BACKGROUND or lower so they are less likely to interrupt the UI thread.You can also find about every alert in the trace by clicking the Alerts tab to the far right of the window. Doing so expands the Alerts panel, where you can see every alert that the tool discovered in your trace, along with an occurrence count.The Alerts panel helps you see which problems occur in the trace, and how often they contribute to jank. Think of the alerts panel as a list of bugs to be fixed, often a tiny change or improvement in one area can eliminate an entire class of alerts from your application.
Perceived Performance In the previous sections, we discussed how to make your UI fast through testing, discovering issues, and optimising layouts. But there is another possible way to make your Android UI faster: make it appear faster. Of course, it is crucial that you work to optimise all of the code, views, overdraw, and other issues that might affect your UI first to really make your app as fast as possible. However, once you have done that, there are still a few ways to make your app appear faster to your customers.The human mind behaves in interesting ways, and by changing the perception of waiting, you can make the delay seem shorter to your users. This is exactly why grocery stores put trashy magazines in the checkout aisle, as having something to look at makes the delay seem shorter. If you can deliver content in a way to make the delivery appear seamless, more power to you. It may seem like a sleight of hand trick to make users feel like things are happening faster, but at the end, it is the perception of how fast your app loads that matter. This is tricky to implement well, as some perceived performance optimisations have backfired, so always A/B test to ensure that these help your customers feel the speed of your app.
Spinners: The Good and the Bad By changing the perception of the wait, the app became faster. Facebook found similar data: using a custom spinner in their iOS app made their load time appear longer than when they used a standard spinner.The addition of a spinner should be accompanied by user testing to ensure that the results are expected. In general, spinners are acceptable when a delay is expected: opening a new page or downloading an image over the network. But if the delay will be short (say less than one second), you should consider omitting the spinner. In these cases, the addition of the spinner implies a delay that is not really there.
The White Lie of Instant Updates If your customers make an update on the page, immediately change the data on the page, even if the data has not yet hit the server (of course, you need to ensure that these updates 100% do eventually get updated on the server).They call this an “optimistic action,” in that the update will appear on the website and be visible to friends within a few seconds (or minutes if in a tunnel, or area with low coverage), but the update will occur, and there is no need to wait for the server to update to update the UI. The mobile user does not feel obligated to wait to “make sure it worked.An added advantage to instantly upgrade the UI without requiring the update to post on the server is that your app appears to function when coverage is intermittent (like when your train enters a tunnel on the commute home). Flipboard, in Offline Network Queue has presented its queueing architecture, which is used to upload changes made while offline, and this could easily be used to immediately change the UI, and update the backend a moment or two later.
Another performance trick (that is essentially the opposite of upload later) is to upload ahead of time. For apps like Instagram where large uploads of photos can add delay updates to the main UI, you can begin uploading those big files early. Instagram realised that the slowest step in post creation was data entry. While the user adds text to the image post, Instagram uploads the photo to the server before the post is made public. Once the customer hits the post button, only the text and the post command needs to be uploaded, and the perception is that the upload happened in no time. To think of it another way, Instagram was able to answer the question “should we add a spinner?” by architecting its app to never need a spinner.
Conclusion
The user experience of your Android app is directly tied to the way it appears on the screen. If your app is slow to load or if the scrolling is not fast and smooth, your customers will be left with a negative perception of your app. In this blog, I’ve covered examples of the view hierarchy and profiled how flattening and simplifying views speed rendering. I’ve considered overdrawing the screen, and the tools used to identify overdraw issues. For problems that require deeper digging (into CPU issues), Systrace is great at debugging and determining the issues causing jank. Finally, some tricks make you appear faster and more responsive through tricks in rendering and moving CPU/network tasks out of the critical path of rendering. In the next blog, I’ll try to cover how optimising and reduce the CPU usage of your app will improve the performance.
References :
- Are you a rarity? Only 16 Percent of people will try out an App more than twice By Joshua Pramis
- Android Performance: UI (Google I/O ’17)
- Scaling Instagram, Tech Talk by Mike Krieger, Instagram
- High-Performance Android Apps by Doug Sillars
- https://developer.android.com/training/constraint-layout/index.html
- https://developer.android.com/studio/profile/systrace.html
Nice summary to new tools..
Finally some great profiling ability for Android IDE