The biggest secret of JDK – Part 2
Click here to read about The biggest secret of JDK- Part 1
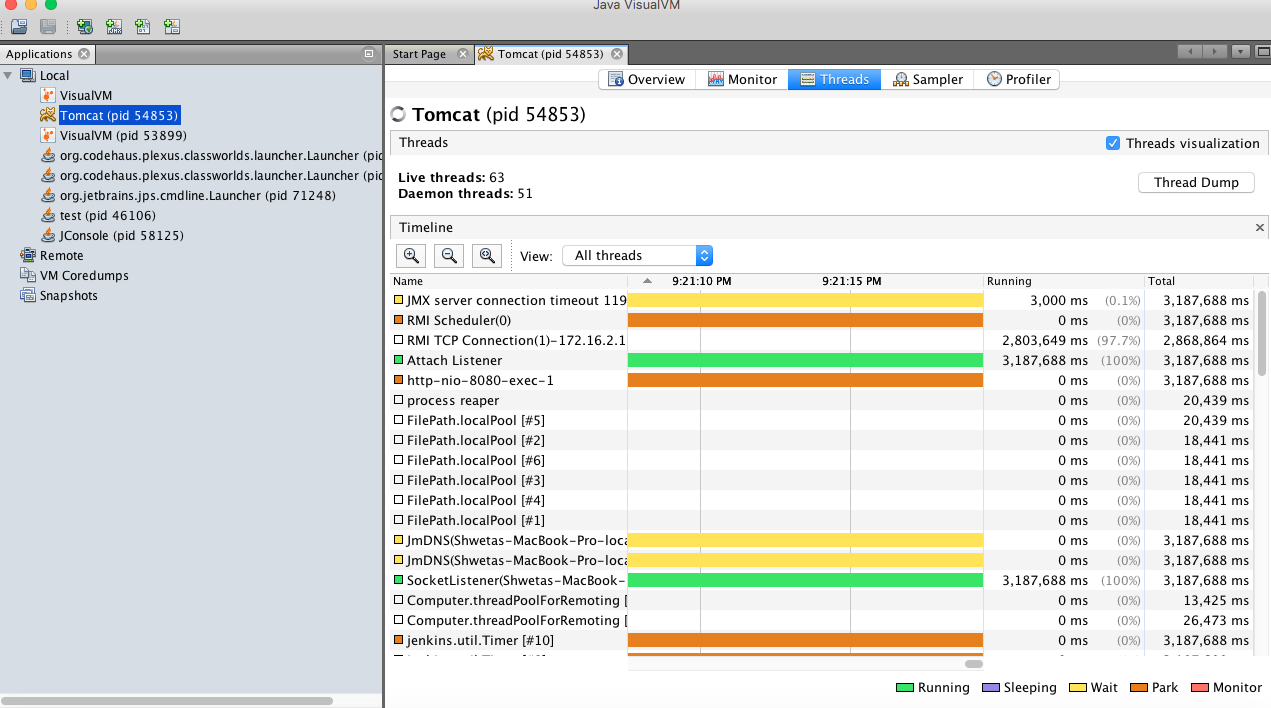
JVisualVM
Things move fast in production and we do not have immense time to spare with our application profiling. Here comes the use of JVisualVM which will help us to take dumps (i.e. thread dump and heap dump) and save it for later use. You can as well monitor thread scheduling here.You may also need to add some environment variables if you want to monitor tomcat.
1 export JAVA_OPTS="-Dcom.sun.management.jmxremote=true
2  -Dcom.sun.management.jmxremote.port=9090
3  -Dcom.sun.management.jmxremote.ssl=false
4  -Dcom.sun.management.jmxremote.authenticate=false
5  -Djava.rmi.server.hostname=172.16.2.158"
Explanation of above command
Line 1 enables jmx remote.
Line 2 specifies jmx port.
Line 3 disable ssl.
Line 4 disables any sort of authentication.
Line 5 specifies the ip address of the server where the Tomcat is currently running. (Substitute your own IP here).
JVisualVM
Apart from these tools, JDK also contain some command-line profiling tools which focuses on figuring out on just one aspect of a running Java process. Mostly all the command line tools require you to provide the java process identifier in order to monitor it. The “VMID” identifier is not always the same as the native operating system process identifier (“pid”), which is why we need the JDK’s jps utility.
JPS
JPS returns the VMIDs for all discoverable Java processes running on a given machine. If the Java process can be found, jps will list the command-line used to launch it. After loading your app, use the command “jps“. It will give you VMID for which the program is running.
JSTAT
JSTAT can be used to get information regarding class, compiler, GC, gccapacity etc. For example if you want to get a GC dump the following command will help you
jstat -gc 5957
Here 5957 is the VMID of the process you are looking for. It displays a single line of output with no timestamp. The column headings are described in jstat documentation
jstat -gc 55406
   S0C S1C S0U S1U EC EU OC OU MC MU CCSC CCSU YGC YGCT FGC FGCT GCT
   6656.0 8192.0 1280.1 0.0 50688.0 16946.3 28160.0 19924.4 47616.0 44435.1 7168.0 6315.7 26 0.184 2 0.167 0.351
JStack
JStack is a utility that returns a complete dump of the various threads running in an app, which you can then use to pinpoint the problem. The command being
jstack 5957
Again 5957 is the VMID of the process you are looking for. JStack’s -l parameter offers up a slightly longer dump that includes more detailed information about the locks held by each of the Java threads. The output will look something like this
“Java2D Queue Flusher” #18 daemon prio=10 os_prio=31 tid=0x00007fb72421a000 nid=0xc807 in Object.wait() [0x0000700001861000]
java.lang.Thread.State: TIMED_WAITING (on object monitor)

at java.lang.Object.wait(Native Method)

at sun.java2d.opengl.OGLRenderQueue$QueueFlusher.run(OGLRenderQueue.java:203)

- locked <0x00000007b033d4d8> (a sun.java2d.opengl.OGLRenderQueue$QueueFlusher)
The JStack command prints Java stack traces of Java threads for a specified Java process, core file, or remote debug server. For each Java frame, the full class name, method name, byte code index (BCI), and line number, when available, are printed.
JMAP
JMAP helps us to locate the memory leak by taking a picture of the heap at a given moment in time. JMap provides the first part of that functionality by taking a snapshot picture of the heap. You can use the options -heap, -histo, or -permstat.
pre jmap -heap 5957
JHAT
JHAT can be used to analyze the binary heap dump file. JHat creates an HTTP/HTML server that can be surfed in a browser, giving an object-by-object view of the heap, frozen in time. While it could be amusing to walk through the heap, object reference by object reference, you’re probably better served by doing some kind of automated analysis of the whole mess.
By:
Shweta Shaw
Coviam Technologies
2 thoughts on “The biggest secret of JDK – Part 2”