The biggest secret of JDK – Part 1
If you guessed Application Monitoring tools, you are right!!!
Many a time when our application suffers with issues like memory leaks, out of memory, unexpected load etc., we panic and sometimes we don’t even know where to start looking for these issues. One of the best place to start with is the java performance profiling tools which comes with the JDK itself.
JConsole and JVisualVM are some of the APM tools that can be used to track the bottleneck in our Java Code.There are other useful tool which can also be very useful in such scenarios.
Let me take you through the Java language keywords we just made use of in the starting of the blog by giving you a brief understanding of how the process works and under which scenarios.
JConsole
JConsole is a JMX- Compliant monitoring tool. It uses the extensive JMX instrumentation of the java virtual machine to provide information on performance and resource consumption of applications running on the java platform.
Now let’s start off with launching the JConsole in the virtual machines.
If you have already mentioned JAVA_HOME in your classpath, you should be able to open these tools by just typing “jconsole” or “jvisualvm” from the command prompt. Or if you know the pid of the process that you want to monitor,you can directly make use of the below command:
jconsole 81081 (where 81081 is the process id)
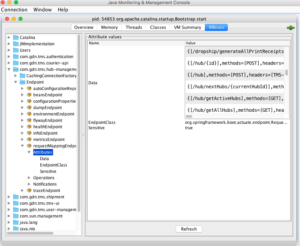
To monitor all the apps deployed in your tomcat you should give pid of tomcat. PID stands for Process ID which remains unique to every process. After you are connected you should be able to see the endpoints in the MBeans section for all the apps in your tomcat.
App endpoint view from JConsole
Not just your app endpoints you can also have view health endpoints, flyway endpoints, dump endpoints and a lot more from here. You can also set up the remote monitoring, based on which application you want to monitor remotely. JConsole has various tabs like
Let’s go over them one by one.
Memory
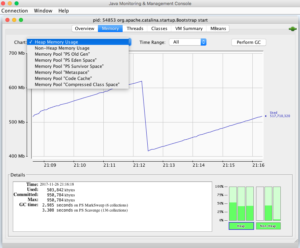
Memory Tab displays the history of usage of each memory pool in JVM. It also gives you information related to memory limit, used and unused heap and non-heap area like meta space etc.
JConsole
Thread
When it comes to Thread section we can track how many live threads are there along with max thread limit and the stack trace of each. In this section, there is also an option that will help you to detect deadlock if there exist any.
Classes
Class tab tells you about how many classes are loaded and unloaded.
VM Summary
VM Summary tab contains the snapshot of all the details clubbed together along with some OS level informations.
MBeans
MBEANS Tab allows you to inspect the state of the platform MBeans.The complete list of Beans are available in this section along with some meta data containing the information about the attribute names, operations it perform and any notifications that you want to subscribe or unsubscribe. You can also refer the first image which shows the endpoints of the app.
That was all about JConsole.Making use of the statistical graph we can easily figure out that the spike goes high on memory tab when more memory is consumed and becomes a threat when it doesn’t come down.There is also an option to trigger the action of garbage collection action to take place by clicking the Perform GC Button, but triggering it still doesn’t guarantee that it will always perform GC.
By:
Shweta Shaw
Coviam Technologies


1 thought on “The biggest secret of JDK – Part 1”